
收集容器中日志 Log-polit Kafka Logstash Elasticsearch Kibana
Log-polit
简介
Log-pilot通过声明式配置实现强大的容器事件管理,可同时获取容器标准输出和内部文件日志,解决了动态伸缩问题,此外,Log-pilot具有自动发现机制、CheckPoint及句柄保持的机制、自动日志数据打标、有效应对动态配置、日志重复和丢失以及日志源标记等问题。
目前Log-pilot在Github完全开源,项目地址是 github。您可以深入了解更多实现原理。
针对容器日志的声明式配置
在Kubernetes下,Log-pilot可以依据环境变量 aliyun_logs_$name = $path 动态地生成日志采集配置文件,其中包含两个变量:
$name是自定义的一个字符串,它在不同的场景下指代不同的含义,在本场景中,将日志采集到Elasticsearch的时候,这个$name表示的是Index。$path,支持两种输入形式,stdout和容器内部日志文件的路径,分别对应日志标准输出和容器内的日志文件:- 第一种约定关键字stdout表示的是采集容器的标准输出日志,本例采集tomcat容器日志,那么通过配置标签
aliyun.logs.catalina=stdout来采集tomcat标准输出日志。 - 第二种是容器内部日志文件的路径,也支持通配符的方式,通过配置环境变量
aliyun_logs_access=/usr/local/tomcat/logs/*.log来采集tomcat容器内部的日志。当然如果您不想使用aliyun这个关键字,Log-pilot也提供了环境变量PILOT_LOG_PREFIX可以指定自己的声明式日志配置前缀,例如PILOT_LOG_PREFIX: "aliyun,custom"。
- 第一种约定关键字stdout表示的是采集容器的标准输出日志,本例采集tomcat容器日志,那么通过配置标签
此外,Log-pilot还支持多种日志解析格式,通过aliyun_logs_$name_format=<format>标签告诉Log-pilot在采集日志的时候,同时以哪种格式来解析日志记录,支持的格式包括:NONE、JSON、CSV、NGINX、APACHE2和REGXP。
Log-pilot同时支持自定义tag,我们可以在环境变量里配置aliyun_logs_$name_tags="K1=V1,K2=V2",那么在采集日志的时候也会将K1=V1和K2=V2采集到容器的日志输出中。自定义tag可帮助您给日志产生的环境打上tag,方便进行日志统计、日志路由和日志过滤。
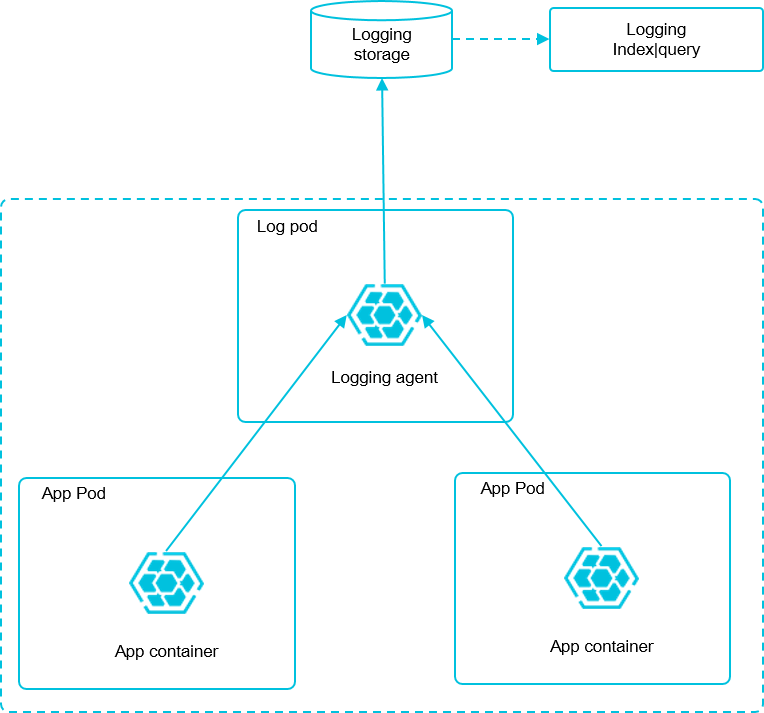
日志采集模式
部署Log-pilot组件
直接收集到 Elasticsearch
apiVersion: apps/v1
kind: DaemonSet
metadata:
  name: log-pilot
  labels:
    app: log-pilot
  # 设置期望部署的namespace(最好选择 kube-system, 否则可能会收集不到日志)。
  namespace: kube-system
spec:
  selector:
    matchLabels:
      app: log-pilot
  updateStrategy:
    type: RollingUpdate
  template:
    metadata:
      labels:
        app: log-pilot
      annotations:
        scheduler.alpha.kubernetes.io/critical-pod: ''
    spec:
      # 是否允许部署到Master节点上tolerations。
      tolerations:
      - key: node-role.kubernetes.io/master
        effect: NoSchedule
      containers:
      - name: log-pilot
        # 版本请参考https://github.com/AliyunContainerService/log-pilot/releases。
        image: registry.cn-hangzhou.aliyuncs.com/acs/log-pilot:0.9.7-filebeat
        resources:
          limits:
            memory: 500Mi
          requests:
            cpu: 200m
            memory: 200Mi
        env:
          - name: "NODE_NAME"
            valueFrom:
              fieldRef:
                fieldPath: spec.nodeName
          - name: "LOGGING_OUTPUT"
            value: "elasticsearch"
          # 请确保集群到ES网络可达。
          - name: "ELASTICSEARCH_HOSTS"
            value: "{es_endpoint}:{es_port}"
          # 配置ES访问权限。
          - name: "ELASTICSEARCH_USER"
            value: "{es_username}"
          - name: "ELASTICSEARCH_PASSWORD"
            value: "{es_password}"
        volumeMounts:
        - name: sock
          mountPath: /var/run/docker.sock
        - name: root
          mountPath: /host
          readOnly: true
        - name: varlib
          mountPath: /var/lib/filebeat
        - name: varlog
          mountPath: /var/log/filebeat
        - name: localtime
          mountPath: /etc/localtime
          readOnly: true
        livenessProbe:
          failureThreshold: 3
          exec:
            command:
            - /pilot/healthz
          initialDelaySeconds: 10
          periodSeconds: 10
          successThreshold: 1
          timeoutSeconds: 2
        securityContext:
          capabilities:
            add:
            - SYS_ADMIN
      terminationGracePeriodSeconds: 30
      volumes:
      - name: sock
        hostPath:
          path: /var/run/docker.sock
      - name: root
        hostPath:
          path: /
      - name: varlib
        hostPath:
          path: /var/lib/filebeat
          type: DirectoryOrCreate
      - name: varlog
        hostPath:
          path: /var/log/filebeat
          type: DirectoryOrCreate
      - name: localtime
        hostPath:
          path: /etc/localtime
| 参数 | 描述 |
|---|---|
| ES集群的访问地址。 | |
| 如果Kubernetes集群和部署的ES集群在同一个VPC下,则该地址为ES集群基本信息中的内网地址。如果Kubernetes集群和部署的ES集群不在同一个VPC下,则该地址为ES集群基本信息中的公网地址。 | |
| 访问ES集群的用户名。即为创建ES集群时,设置的用户名。 | |
| 访问ES集群的用户密码。即为创建ES集群时,设置的用户密码。 |
收集到 kafka
apiVersion: apps/v1
kind: DaemonSet
metadata:
  name: log-pilot
  labels:
    app: log-pilot
  # 设置期望部署的namespace。
  namespace: kube-system
spec:
  selector:
    matchLabels:
      app: log-pilot
  updateStrategy:
    type: RollingUpdate
  template:
    metadata:
      labels:
        app: log-pilot
      annotations:
        scheduler.alpha.kubernetes.io/critical-pod: ''
    spec:
      # 是否允许部署到Master节点上tolerations。
      tolerations:
      - key: node-role.kubernetes.io/master
        effect: PreferNoSchedule
      containers:
      - name: log-pilot
        # 版本请参考https://github.com/AliyunContainerService/log-pilot/releases。
        image: registry.cn-hangzhou.aliyuncs.com/acs/log-pilot:0.9.7-filebeat
        resources:
          limits:
            memory: 500Mi
          requests:
            cpu: 200m
            memory: 200Mi
        env:
          - name: "NODE_NAME"
            valueFrom:
              fieldRef:
                fieldPath: spec.nodeName
          - name: "LOGGING_OUTPUT"
            value: "kafka"
          - name: "KAFKA_BROKERS"
            value: "IP:PORT"
        volumeMounts:
        - name: sock
          mountPath: /var/run/docker.sock
        - name: root
          mountPath: /host
          readOnly: true
        - name: varlib
          mountPath: /var/lib/filebeat
        - name: varlog
          mountPath: /var/log/filebeat
        - name: localtime
          mountPath: /etc/localtime
          readOnly: true
        livenessProbe:
          failureThreshold: 3
          exec:
            command:
            - /pilot/healthz
          initialDelaySeconds: 10
          periodSeconds: 10
          successThreshold: 1
          timeoutSeconds: 2
        securityContext:
          capabilities:
            add:
            - SYS_ADMIN
      terminationGracePeriodSeconds: 30
      volumes:
      - name: sock
        hostPath:
          path: /var/run/docker.sock
      - name: root
        hostPath:
          path: /
      - name: varlib
        hostPath:
          path: /var/lib/filebeat
          type: DirectoryOrCreate
      - name: varlog
        hostPath:
          path: /var/log/filebeat
          type: DirectoryOrCreate
      - name: localtime
        hostPath:
          path: /etc/localtime
| 参数 | 含义 |
|---|---|
| KAFKA_BROKERS | "(required) kafka brokers" |
| KAFKA_VERSION | "(optinal) kafka version" |
| KAFKA_USERNAME | "(optianl) kafka username" |
| KAFKA_PASSWORD | "(optianl) kafka password" |
| KAFKA_PARTITION_KEY | "(optinal) kafka partition key" |
| KAFKA_PARTITION | "(optinal) kafka partition strategy" |
| KAFKA_CLIENT_ID | "(optinal) the configurable ClientID used for logging, debugging, and auditing purposes. The default is beats" |
| KAFKA_BROKER_TIMEOUT | "(optinal) the number of seconds to wait for responses from the Kafka brokers before timing out. The default is 30 (seconds)." |
| KAFKA_KEEP_ALIVE | "(optinal) keep-alive period for an active network connection. If 0s, keep-alives are disabled, default is 0 seconds" |
| KAFKA_REQUIRE_ACKS | "(optinal) ACK reliability level required from broker. 0=no response, 1=wait for local commit, -1=wait for all replicas to commit. The default is 1" |
Redis
REDIS_HOST      "(required) redis host"
REDIS_PORT      "(required) redis port"
REDIS_PASSWORD  "(optinal) redis authentication password"
REDIS_DATATYPE  "(optinal) redis data type to use for publishing events"
REDIS_TIMEOUT   "(optinal) redis connection timeout in seconds, default is 5"
file
FILE_PATH             "(required) output log file directory"
FILE_NAME             "(optinal) the name of the generated files, default is filebeat"
FILE_ROTATE_SIZE      "(optinal) the maximum size in kilobytes of each file. When this size is reached, the files are rotated. The default value is 10240 KB"
FILE_NUMBER_OF_FILES  "(optinal) the maximum number of files to save under path. When this number of files is reached, the oldest file is deleted, and the rest of the files are shifted from last to first. The default is 7 files"
FILE_PERMISSIONS      "(optinal) permissions to use for file creation, default is 0600"
logstash
LOGSTASH_HOST            "(required) logstash host"
LOGSTASH_PORT            "(required) logstash port"
采集日志
apiVersion: v1
kind: Pod
metadata:
  name: tomcat
spec:
  containers:
  - name: tomcat
    image: "tomcat:7.0"
    env:
    # 1、stdout为约定关键字,表示采集标准输出日志。
    # 2、配置标准输出日志采集到ES的catalina索引下。
    - name: aliyun_logs_catalina
      value: "stdout"
    # 1、配置采集容器内文件日志,支持通配符。
    # 2、配置该日志采集到ES的access索引下。
    - name: aliyun_logs_access
      value: "/usr/local/tomcat/logs/catalina.*.log"
    # 容器内文件日志路径需要配置emptyDir。
    volumeMounts:
      - name: tomcat-log
        mountPath: /usr/local/tomcat/logs
  volumes:
    - name: tomcat-log
      emptyDir: {}
在上面的编排中,通过在Pod中定义环境变量的方式,动态地生成日志采集配置文件,环境变量的具体说明如下:
aliyun_logs_catalina=stdout表示要收集容器的stdout日志。
aliyun_logs_access=/usr/local/tomcat/logs/catalina.*.log表示要收集容器内/usr/local/tomcat/logs/目录下所有名字匹配catalina.*.log的文件日志。
在本方案的Elasticsearch场景下,环境变量中的$name表示Index,本例中$name即是catalina和access。
KafKa
下载(不要下载 src 包)
http://kafka.apache.org/downloads
安装 JDK
dnf install -y java-11-openjdk
安装 Zookeeper
tar xzf kafka_2.12-2.8.0.tgz
mv kafka_2.12-2.8.0 /user/local/kafka
修改配置
vim /usr/local/kafka/config/zookeeper.properties
dataDir=/tmp/zookeeper  # 数据存储目录和 myid 文件所在目录
clientPort=2181
maxClientCnxns=0
admin.enableServer=false # 是否开启网页管理
admin.serverPort=8080
tickTime=2000
initLimit=10
syncLimit=5
server.1=ceph1:2888:3888 # 添加集群服务器
server.2=ceph2:2888:3888
server.3=ceph3:2888:3888
添加 myid
根据配置文件中server.n 中的 n 在 dataDir 目录中添加 muid 文件
mkdir -p /tmp/zookeeper/
echo 1 > /tmp/zookeeper/myid
添加 systemd 配置文件
vi /etc/systemd/system/zookeeper.service
[Unit]
Description=Apache Zookeeper server
Documentation=http://zookeeper.apache.org
Requires=network.target remote-fs.target
After=network.target remote-fs.target

[Service]
Type=simple
ExecStart= /usr/local/kafka/bin/zookeeper-server-start.sh /usr/local/kafka/config/zookeeper.properties
ExecStop= /usr/local/kafka/bin/zookeeper-server-stop.sh
Restart=on-abnormal

[Install]
WantedBy=multi-user.target
systemctl daemod-reload
systemctl enable zookeeper.service
systemctl start zookeeper.service
检测运行情况
netstat -ntlp # 只要有2181即可
安装 kafka
vi /etc/systemd/system/kafka.service
[Unit]
Description=Apache Kafka Server
Documentation=http://kafka.apache.org/documentation.html
Requires=zookeeper.service

[Service]
Type=simple
Environment="JAVA_HOME=/usr/share/logstash/jdk"
ExecStart=/usr/local/kafka/bin/kafka-server-start.sh /usr/local/kafka/config/server.properties
ExecStop=/usr/local/kafka/bin/kafka-server-stop.sh

[Install]
WantedBy=multi-user.target
修改配置文件
vim /usr/local/kafka/config/server.properties
listeners=PLAINTEXT://host:9092
systemctl daemod-reload
systemctl enable kafka.service
systemctl start kafka.service
检测运行情况
netstat -ntlp # 只要有9092即可
常用命令
# 创建topic
./kafka-topics.sh --create --zookeeper localhost:2181 --replication-factor 1 --partitions 1 --topic test
# 查看topic
./kafka-topics.sh --list --zookeeper localhost:2181

# 使用kafka-console-producer.sh 发送消息
./kafka-console-producer.sh --broker-list localhost:9092 --topic test

# 使用kafka-console-consumer.sh消费消息
./kafka-console-consumer.sh --bootstrap-server localhost:9092 --topic test --from-beginning
Elasticsearch
下载 rpm 包
在如下页面选择合适的安装包
https://www.elastic.co/guide/en/elasticsearch/reference/current/install-elasticsearch.html#install-elasticsearch
使用 rpm 包安装
https://www.elastic.co/guide/en/elasticsearch/reference/current/rpm.html
安装
https://www.elastic.co/guide/en/elasticsearch/reference/current/rpm.html
导入 GPG Key
rpm --import https://artifacts.elastic.co/GPG-KEY-elasticsearch
使用 yum 源安装
[elasticsearch]
name=Elasticsearch repository for 7.x packages
baseurl=https://artifacts.elastic.co/packages/7.x/yum
gpgcheck=1
gpgkey=https://artifacts.elastic.co/GPG-KEY-elasticsearch
enabled=0
autorefresh=1
type=rpm-md
sudo yum install --enablerepo=elasticsearch elasticsearch
sudo dnf install --enablerepo=elasticsearch elasticsearch
使用 rpm 包安装
wget https://artifacts.elastic.co/downloads/elasticsearch/elasticsearch-7.13.2-x86_64.rpm
wget https://artifacts.elastic.co/downloads/elasticsearch/elasticsearch-7.13.2-x86_64.rpm.sha512
shasum -a 512 -c elasticsearch-7.13.2-x86_64.rpm.sha512
sudo rpm --install elasticsearch-7.13.2-x86_64.rpm
修改配置
node-1
node.name: node-1
path.data: /var/lib/elasticsearch
path.logs: /var/log/elasticsearch
network.host: 0.0.0.0
http.port: 9200
discovery.seed_hosts: ["host1:9300", "host2:9300"]
cluster.initial_master_nodes: ["node-1","node-2"]
node-2
node.name: node-2
path.data: /var/lib/elasticsearch
path.logs: /var/log/elasticsearch
network.host: 172.21.0.127
http.port: 9200
discovery.seed_hosts: ["host1:9300", "host2:9300"]
cluster.initial_master_nodes: ["node-1","node-2"]
限制内存
vim /etc/elasticsearch/jvm.options
# 修改如下配置
-Xms2g
-Xmx2g
启动服务
systemctl daemon-reload
systemctl enable elasticsearch.service
systemctl start elasticsearch.service
systemctl stop elasticsearch.service
启动超时
elasticsearch service start operation timed out. Terminating.
当系统重启的时候可能会遇到 elasticsearch 启动超时
vim /usr/lib/systemd/system/elasticsearch.service
将 TimeoutStartSec=75 修改为 imeoutStartSec=infinity(永不超时)
密码启动
echo "keystore_password" > /path/to/my_pwd_file.tmp
chmod 600 /path/to/my_pwd_file.tmp
sudo systemctl set-environment ES_KEYSTORE_PASSPHRASE_FILE=/path/to/my_pwd_file.tmp
sudo systemctl start elasticsearch.service
检测集群状态
curl 'http://localhost:9200/'
curl 'http://localhost:9200/_cluster/health?pretty'
Kibana
https://www.elastic.co/guide/en/kibana/current/rpm.html
安装
导入 PGP Key
rpm --import https://artifacts.elastic.co/GPG-KEY-elasticsearch
使用 yum 源安装
[kibana-7.x]
name=Kibana repository for 7.x packages
baseurl=https://artifacts.elastic.co/packages/7.x/yum
gpgcheck=1
gpgkey=https://artifacts.elastic.co/GPG-KEY-elasticsearch
enabled=1
autorefresh=1
type=rpm-md
sudo yum install kibana
sudo dnf install kibana
使用 rpm 包安装
wget https://artifacts.elastic.co/downloads/kibana/kibana-7.13.2-x86_64.rpm
shasum -a 512 kibana-7.13.2-x86_64.rpm
sudo rpm --install kibana-7.13.2-x86_64.rpm
修改配置
vim /etc/kibana/kibana.yml
server.port: 5601
server.host: "0.0.0.0"
elasticsearch.hosts: ["http://localhost:9200"]
启动服务
sudo /bin/systemctl daemon-reload
sudo /bin/systemctl enable kibana.service
sudo systemctl start kibana.service
sudo systemctl stop kibana.service
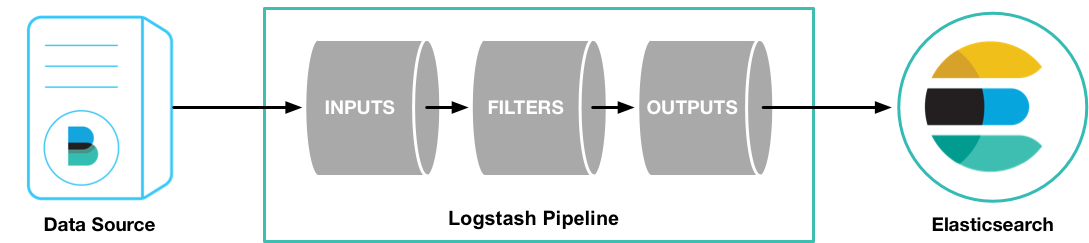
LogStash
https://www.elastic.co/cn/downloads/logstash
安装
yum 源安装
sudo rpm --import https://artifacts.elastic.co/GPG-KEY-elasticsearch
[logstash-7.x]
name=Elastic repository for 7.x packages
baseurl=https://artifacts.elastic.co/packages/7.x/yum
gpgcheck=1
gpgkey=https://artifacts.elastic.co/GPG-KEY-elasticsearch
enabled=1
autorefresh=1
type=rpm-md
sudo yum install logstash
rpm 包安装
wget https://artifacts.elastic.co/downloads/logstash/logstash-7.13.2-x86_64.rpm
rpm -i logstash-7.13.2-x86_64.rpm
修改配置文件
vim /etc/logstash/logstash.yml
http.host: "host"
启动服务
systemctl daemon-reload
sytemctl enable logstash.service
systemctl start logstash.service
注意:如果 /etc/logstash/conf.d/ 中没有任务配置,日志中会报错。
但是用 systemctl status logstash 查看服务器状态是正常的。
配置任务
vim /etc/logstash/conf.d/kafka.conf
input {
  kafka {
    bootstrap_servers => "127.0.0.1:9092"
    client_id => "halo"
    group_id => "halo"
    topics => ["access"]
    decorate_events => true
    consumer_threads => 1
    auto_offset_reset => "latest"
    enable_auto_commit => true
    codec => "json"
  }
}
output {
  elasticsearch {
    hosts => ["127.0.0.1:9200"]
    index => "halo-%{+YYYYMM}"
    document_type => "access_log"
    }
}
安装报内存不足
2核4g 的云服务器安装的时候报内存不足
开启 swap
创建 swap 文件
sudo fallocate -l 4G /swapfile
设置文件权限
只有 root 用户可以读写 swap 文件
sudo chmod 600 /swapfile
在这个文件上设置 Linux swap
sudo mkswap /swapfile
激活 swap
sudo swapon /swapfile
查看 swap
sudo swapon --show
写入 fstab
vim /etc/fstab
/swapfile swap swap defaults 0 0
调整 Swappiness 值
Swappiness 是一个 Linux Kernel 属性值,它定义了系统使用 swap 空间的频率。Swappiness 取值范围从 0 到 100。一个较低的值使得 kernel 尽可能避免使用交换内存,而较高的值将使得 kernel 尽可能的使用交换内存空间。
在 CentOS 8 上 swappiness 默认值是 30。你可以通过输入下面的命令检测当前的 swappiness 值:
cat /proc/sys/vm/swappiness
当 swappiness 值为 30 的时候,它是适合桌面版本和开发版本的机器的,而对于生产服务器,你可能需要调低这个值。 例如,将 swappiness 值调低为 10,输入:
sudo sysctl vm.swappiness=10
想要持久化这个参数,应该将下面的内容粘贴到/etc/sysctl.conf文件,并且重新启动:
vm.swappiness=10
移除 swap 文件
取消激活
sudo swapoff -v /swapfile
取消 fatab 挂载
从/etc/fstab文件中移除 swap 条目/swapfile swap swap defaults 0 0
使用rm删除实际的 swap 文件
sudo rm /swapfile
Nginx 容器配置
因为 logstash 中配置的日志收集格式为 json ,所以要将 ningx 的日志格式改为json
vim nginx.conf
log_format main
                      '{"@timestamp":"$time_iso8601",'
                      '"host":"$hostname",'
                      '"server_ip":"$server_addr",'
                      '"client_ip":"$remote_addr",'
                      '"xff":"$http_x_forwarded_for",'
                      '"domain":"$host",'
                      '"url":"$uri",'
                      '"referer":"$http_referer",'
                      '"args":"$args",'
                      '"upstreamtime":"$upstream_response_time",'
                      '"responsetime":"$request_time",'
                      '"request_method":"$request_method",'
                      '"status":"$status",'
                      '"size":"$body_bytes_sent",'
                      '"request_body":"$request_body",'
                      '"request_length":"$request_length",'
                      '"protocol":"$server_protocol",'
                      '"upstreamhost":"$upstream_addr",'
                      '"file_dir":"$request_filename",'
                      '"http_user_agent":"$http_user_agent"'
    '}';
access_log  /var/log/nginx/access.log  main;
Nginx Deployment 配置
apiVersion: apps/v1
kind: Deployment
metadata:
  namespace: halo
  name: halo-nginx
spec:
  replicas: 1
  selector:
    matchLabels:
      app: halo-nginx
  template:
    metadata:
      labels:
        app: halo-nginx
    spec:
      containers:
        - name: halo-nginx
          image: nginx:latest
          env:
          - name: aliyun_logs_catalina
            value: "stdout"
          - name: aliyun_logs_access
            value: "/var/log/nginx/access.log"
          imagePullPolicy: IfNotPresent
          ports:
          - containerPort: 443
          volumeMounts:
          - name: nginx-config-volume
            mountPath: /etc/nginx/nginx.conf
            subPath: nginx.conf
          - name: secret-cert-volume
            mountPath: /etc/nginx/cert
          - name: nginx-access-log
            mountPath: /var/log/nginx
      volumes:
        - name: nginx-config-volume
          configMap:
            name: halo-nginx-conf
            items:
            - key: nginx.conf
              path: nginx.conf
        - name: secret-cert-volume
          secret:
            secretName: halo-nginx-cert
        - name: nginx-access-log