
Go高性能系列教程之二:性能评估和分析
2. 性能评估和分析
在上一节中,我们研究了对单个函数进行基准测试,这个的使用场景是在你已经提前知道瓶颈在哪里时很有用。
但是,通常你会发现你并不知道性能瓶颈在哪里,你经常会问:
程序为什么耗时这么久?
对于上面的问题,我们需要对整个程序进行概要分析以找出程序的瓶颈在哪里。本节,我们讲使用Go的内置性能分析工具pprof从内部查看程序的整体运行情况。
2.1 pprof
今天我们要讨论的第一个工具是 pprof. pprof诞生自Google Perf Tools工具套件,并且已经集成到Go运行时环境中。
pprof由两部分组成:
- runtime/pprof 运行时包。
- go tool pprof工具。用于分析性能。
2.2 性能类型
pprof支持以下类型的性能分析:
- CPU性能分析
- 内存性能分析
- 阻塞性能分析
- 互斥&竞争分析
2.2.1 CPU性能分析 (CPU profiling)
CPU性能分析是最常用、最明确的性能分析。 当CPU性能分析启用的时候,运行时环境会每10毫秒中断一次并记录下当前运行协程的堆栈跟踪信息。
一旦性能分析完成,我们就可以分析并找出执行耗时最长的代码路径。一个函数在性能分析中出现的次数越多,则其所在的代码路径花费的时间就越长。
2.2.2 内存性能分析(Memory profiling)
内存性能分析记录了堆内存分配的调用栈信息。栈内存分配的耗时可以忽略不计,所以不计入到内存性能分析中。
和CPU数据采集类似,内存数据采集默认是每分配1000次则采样一次。 由于内存数据采集是基于采样的,并且由于它跟踪的是未使用的分配,因此该技术很难确定应用程序的整体内存使用情况。
个人观点:我并没有发现内存分析对找到内存峰值有用。稍后我们将介绍一些较好的方式用来查看到应用程序整体使用内存情况。
2.2.3阻塞性能分析(Blocking profiling)
阻塞分析是Go中独有的。 一个阻塞分析类似于CPU的性能分析,但是它记录的是一个协程花在等待共享资源上的时间。
这对于分析并发瓶颈非常有用。
阻塞分析可以显示出大量goroutine何时可以取得进展,但不阻止了。阻塞包括:
- 向一个非缓存的通道(unbuffered channel)上发送或接收数据
- 向一个已满的通道发送数据,或从一个空通道上接收数据
- 试图给一个互斥资源加锁,而该互斥资源已经被另一个协程占用。
阻塞分析是一个非常特殊的工具,你应该首先解决你的CPU、内存瓶颈之后,再来分析阻塞性能。
2.2.4 互斥性能分析
互斥分析类似于阻塞分析,但是它主要关注在导致互斥锁征用导致延迟的操作上。
互斥分析不能提供给你该程序将要运行多长时间,以及已经运行了多长时间。相反,它能够记录该程序在等待互斥锁上花费了多长时间。就像阻塞分析,它指出的是在等待资源上花费了多长时间。
换句话说,就是如果互斥竞争被移除,那么会节省多少时间。
2.3 一次只做一类性能分析
性能分析并不是没有成本的。
性能分析对程序是有一定的影响的,尤其是当你增加了内存分析采样频率的时候。
大多数工具不会阻止你一次启用多个性能分析。
注意:不要一次启用多个类型的性能分析 如果你一次启用多个类型的性能分析,每个类型的只会关注自己的交互并且会丢掉其他的结果。
2.4 采集性能概况数据
Go语言的运行时性能采集接口在runtime/pprof包下。runtime/pprof是比较低层的工具,并且由于历史原因,不同类型的性能概况收集接口也不统一。
正如我们上面看到的,pprof概况收集是testing包中内置的,但有时将你要分析的代码放在test.B基准测试环境中会带来不变或困难,并且必须直接使用runtime/pprof的API。
2.5 利用pprof分析一个测量文件
到目前为止,我们已经讨论了pprof功能能够评估什么,并且如何产生一个评估概要文件,接下来让我们讨论使用pprof工具如何分析一个评估概要文件。
通过以下命令分析概要评估文件的内容:
go tool pprof /path/to/your/profile
该工具提供了分析数据的几种不同形式:文本、图表以及火焰图。
如果你已经用过Go一段时间了,你可能已经被告知说pprof会使用两个参数。从Go 1.9开始,概要文件包含了概要分析所有的信息。你不再需要单独生成概要分析文件了。
2.5.1 进一步阅读
Profiling Go programs(Go Blog)
Debugging performance issues in Go Programs
2.5.2 CPU性能分析(练习)
让我写一段统计单词的代码:
package main

import (
    "fmt"
    "os"
    "runtime/pprof"
)

func fib(n int) int {
    if n <= 1 {
        return 1
    }

    return fib(n-1) + fib(n-2)
}

func main() {
    f, _ := os.OpenFile("cpu.profile", os.O_CREATE|os.O_RDWR, 0644)
    defer f.Close()
    pprof.StartCPUProfile(f)
    defer pprof.StopCPUProfile()

    n := 10
    for i := 1; i <= 5; i++ {
        fmt.Printf("fib(%d)=%d\n", n, fib(n))
        n += 3 * i
    }
}
执行go run main.go,会生成一个cpu.profile文件。
go run .\main.go
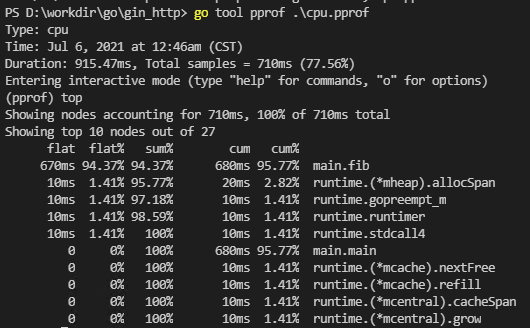
cpu.profile 记录了程序的运行状态。使用go tool pprof命令分析这个文件:
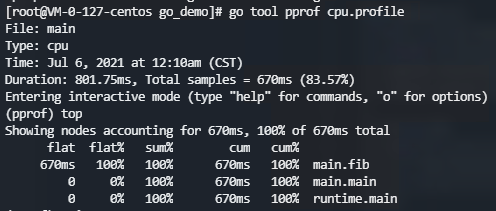
上面用top命令查看耗时最高的 10 个函数。可以看到fib函数耗时最高,累计耗时 670ms,占了总耗时的 100%。
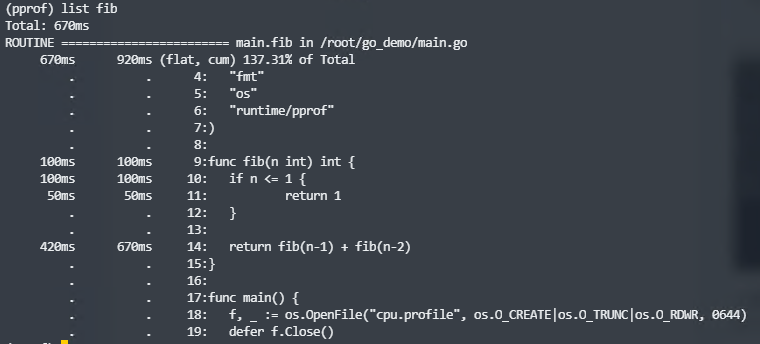
当找到耗时较多的函数,我们还可以使用list命令查看该函数是怎么被调用的,各个调用路径上的耗时是怎样的。list命令后跟一个表示方法名的模式:
我们知道使用递归求解斐波那契数存在大量重复的计算。下面我们来优化一下这个函数:
func fib2(n int) int {
  if n <= 1 {
    return 1
  }

  f1, f2 := 1, 1
  for i := 2; i <= n; i++ {
    f1, f2 = f2, f1+f2
  }

  return f2
}
改用迭代之后耗时如何呢?我们来测一下。首先执行go run main.go生成cpu.profile文件,然后使用go tool pprof分析:
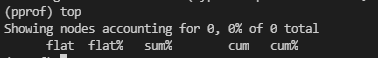
这里 top 看到的列表是空的。因为启用 CPU profiling 之后,运行时每隔 10ms 会中断一次,记录每个 goroutine 当前执行的堆栈,以此来分析耗时。我们优化之后的代码,在运行时还没来得及中断就执行完了,因此没有信息。
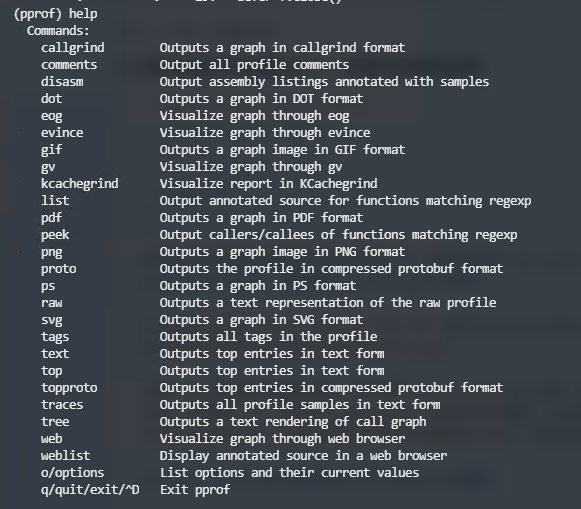
go tool pprof 执行的所有命令可以通过help查看:
2.5.3 内存分析(练习)
内存分析有所不同,我们可以在程序运行过程中随时查看堆内存情况。下面我们编写一个生成随机字符串,和将字符串重复n次的函数:
package main

import (
    "bytes"
    "math/rand"
    "os"
    "runtime/pprof"
)

const Letters = "abcdefghijklmnopqrstuvwxyzABCDEFGHIJKLMNOPQRSTUVWXYZ"

func generate(n int) string {
    var buf bytes.Buffer
    for i := 0; i < n; i++ {
        buf.WriteByte(Letters[rand.Intn(len(Letters))])
    }
    return buf.String()
}

func repeat(s string, n int) string {
    var result string
    for i := 0; i < n; i++ {
        result += s
    }

    return result
}
func main() {
    f, _ := os.OpenFile("mem.profile", os.O_CREATE|os.O_TRUNC|os.O_RDWR, 0644)
    defer f.Close()
    for i := 0; i < 1000; i++ {
        _ = repeat(generate(100), 100)
    }
    // time.Sleep(time.Second)
    pprof.Lookup("heap").WriteTo(f, 0)
}
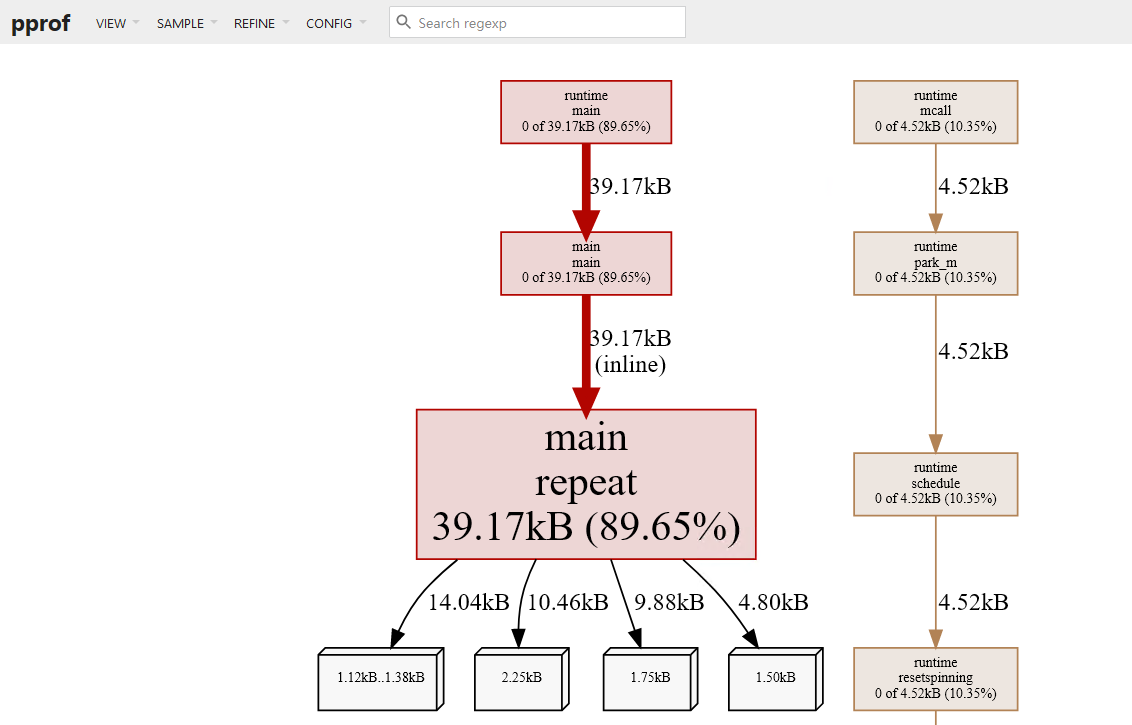
这里在循环结束后,通过pprof.Lookup("heap")查看堆内存的占用情况,并将结果写到文件mem.profile中。
运行go run main.go生成mem.profile文件,然后使用go tool pprof mem.profile来分析:
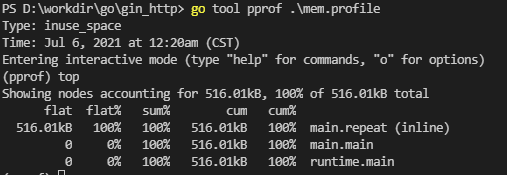
当然也可以使用list命令查看,内存在哪一行分配的:
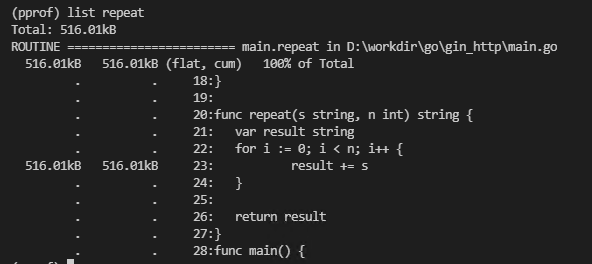
结果在预期之中,因为字符串拼接要会占用不少临时空间。
2.6 pkg/profile
runtime/pprof使用起来有些不便,因为要重复编写打开文件,开启分析,结束分析的代码。所以出现了包装了runtime/pprof的库:pkg/profile。pkg/profile的 GitHub 仓库地址为:https://github.com/pkg/profile。
pkg/profile只是对runtime/pprof做了一层封装,让它更好用。使用pkg/profile可以将代码简化为一行。
使用前需要使用go get github.com/pkg/profile获取这个库。
defer profile.Start().Stop()
默认启用的是 CPU profiling,数据写入文件cpu.pprof。使用它来分析我们的fib程序性能:
package main

import (
    "fmt"
    "os"

    "github.com/pkg/profile"
)

func fib(n int) int {
    if n <= 1 {
        return 1
    }

    return fib(n-1) + fib(n-2)
}

func main() {
    defer profile.Start(profile.CPUProfile, profile.ProfilePath(".")).Stop()

    f, _ := os.OpenFile("cpu.profile", os.O_CREATE|os.O_TRUNC|os.O_RDWR, 0644)
    defer f.Close()

    n := 10
    for i := 1; i <= 5; i++ {
        fmt.Printf("fib(%d)=%d\n", n, fib(n))
        n += 3 * i
    }
}
如果要启用 Memory profiling,可以传入函数选项MemProfile:
package main

import (
	"bytes"
	"math/rand"

	"github.com/pkg/profile"
)

const Letters = "abcdefghijklmnopqrstuvwxyzABCDEFGHIJKLMNOPQRSTUVWXYZ"

func generate(n int) string {
	var buf bytes.Buffer
	for i := 0; i < n; i++ {
		buf.WriteByte(Letters[rand.Intn(len(Letters))])
	}
	return buf.String()
}

func repeat(s string, n int) string {
	var result string
	for i := 0; i < n; i++ {
		result += s
	}

	return result
}

func main() {
	defer profile.Start(profile.MemProfile, profile.ProfilePath(".")).Stop()

	for i := 0; i < 1000; i++ {
		_ = repeat(generate(100), 100)
	}
}
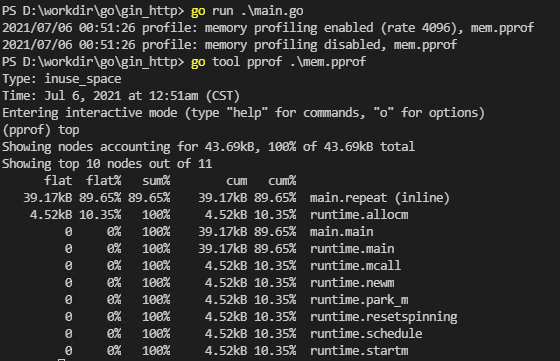
另外还可以通过函数选项控制内存采样率,默认为 4096。我们可以改为 1:
defer profile.Start(profile.MemProfile, profile.MemProfileRate(1)).Stop()
3. 火焰图
通过命令行查看 CPU 或内存情况不够直观。Bredan Gregg 大神发明了火焰图(Flame Graph)可以很直观地看到内存和 CPU 消耗情况。新版本的 go tool pprof 工具已经集成了火焰图(我使用的是 Go1.16)。想要生成火焰图,必须安装 graphviz。
安装
brew install graphviz
yum install graphviz
windows 下载安装包安装,选择加入系统路径
http://www.graphviz.org/download/
使用
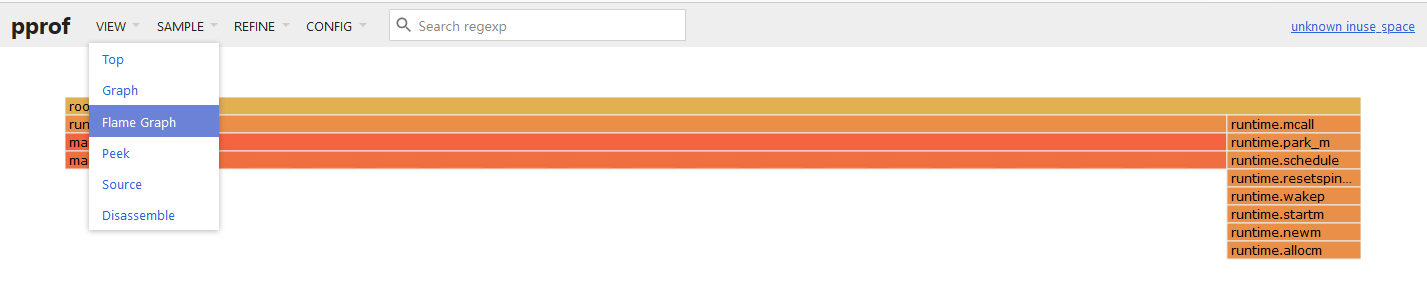
上面程序生成的 cpu.profile 和 mem.profile 我们可以直接在网页上查看火焰图。执行下面命令:
go tool pprof -http :9900 cpu.profile
我们可以在 VIEW 菜单栏中切换显示火焰图:
4. net/http/pprof
如果线上遇到 CPU 或内存占用过高,该怎么办呢?总不能将上面的 Profile 代码编译到生产环境吧,这无疑会极大地影响性能。net/http/pprof提供了一个方法,不使用时不会造成任何影响,遇到问题时可以开启 profiling 帮助我们排查问题。我们只需要使用import这个包,然后在一个新的 goroutine 中调用http.ListenAndServe()在某个端口启动一个默认的 HTTP 服务器即可:
import (
  _ "net/http/pprof"
)

func NewProfileHttpServer(addr string) {
  go func() {
    log.Fatalln(http.ListenAndServe(addr, nil))
  }()
}
下面我们编写一个 HTTP 服务器,将前面示例中的求斐波那契数和重复字符串搬到 Web 上。为了让测试结果更明显一点,我把原来执行一次的函数都执行了 1000 次:
package main

import (
    "encoding/json"
    "log"
    "net/http"
    _ "net/http/pprof"
    "strconv"
)

type Response struct {
    Code int         `json:"code"` // 错误码
    Msg  string      `json:"msg"`  // 错误描述
    Data interface{} `json:"data"` // 返回数据
}

// ToString 返回 JSON 格式的错误详情
func (res *Response) ToString() string {
    err := &struct {
        Code int         `json:"code"`
        Msg  string      `json:"msg"`
        Data interface{} `json:"data"`
    }{
        Code: res.Code,
        Msg:  res.Msg,
        Data: res.Data,
    }
    raw, _ := json.Marshal(err)
    return string(raw)
}

func responseError(w http.ResponseWriter, msg string) {
    var r Response = Response{
        Code: 500,
        Msg:  msg,
        Data: nil,
    }
    w.Write([]byte(r.ToString()))
}

func response(w http.ResponseWriter, data interface{}) {
    var r Response = Response{
        Code: 200,
        Msg:  "",
        Data: data,
    }
    w.Write([]byte(r.ToString()))
}

func fib(n int) int {
    if n <= 1 {
        return 1
    }

    return fib(n-1) + fib(n-2)
}

func NewProfileHttpServer(addr string) {
    go func() {
        log.Fatalln(http.ListenAndServe(addr, nil))
    }()
}

func fibHandler(w http.ResponseWriter, r *http.Request) {
    n, err := strconv.Atoi(r.URL.Path[len("/fib/"):])
    if err != nil {
        responseError(w, err.Error())
        return
    }

    var result int
    for i := 0; i < 1000; i++ {
        result = fib(n)
    }
    response(w, result)
}

func main() {
    mux := http.NewServeMux()
    mux.HandleFunc("/fib/", fibHandler)

    s := &http.Server{
        Addr:    ":9800",
        Handler: mux,
    }

    NewProfileHttpServer(":9900")

    if err := s.ListenAndServe(); err != nil {
        log.Fatal(err)
    }
}
另外为了测试,我编写了一个程序,一直发送 HTTP 请求给这个服务器:
package main

import (
    "fmt"
    "io/ioutil"
    "math/rand"
    "net/http"
    "sync"
    "time"
)

func doHTTPRequest(url string) {
    resp, err := http.Get(url)
    if err != nil {
        fmt.Println("error:", err)
        return
    }

    data, _ := ioutil.ReadAll(resp.Body)
    fmt.Println("ret:", len(data))
    resp.Body.Close()
}

func main() {
    var wg sync.WaitGroup
    wg.Add(1)
    go func() {
        defer wg.Done()
        for {
            doHTTPRequest(fmt.Sprintf("http://localhost:9800/fib/%d", rand.Intn(30)))
            time.Sleep(200 * time.Millisecond)
        }
    }()

    wg.Wait()
}
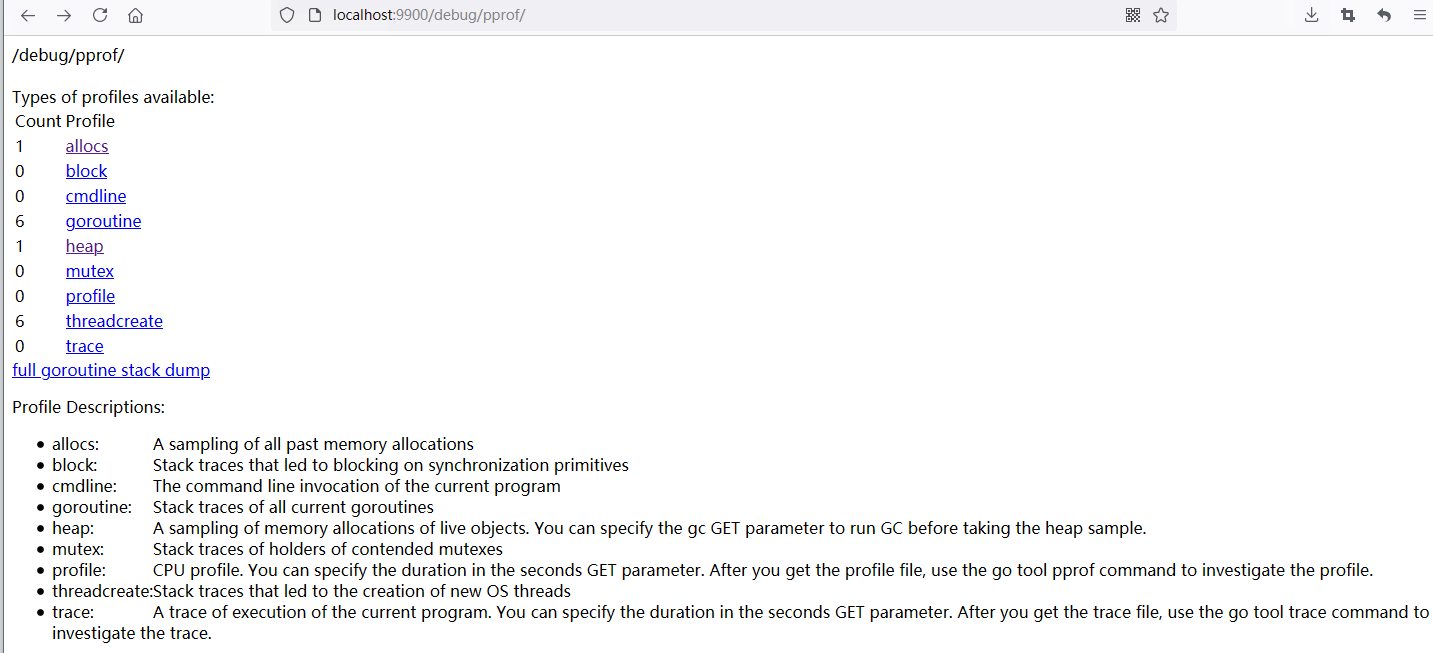
使用命令go run main.go启动服务器。运行上面的程序一直发送请求给服务器。一段时间之后,我们可以用浏览器打开
http://localhost:9900/debug/pprof/:
go tool pprof也支持远程获取 profile 文件:
go tool pprof -http :9700 localhost:9900/debug/pprof/profile?seconds=120
120s 后将会自动打开页面,选择火焰图查看:
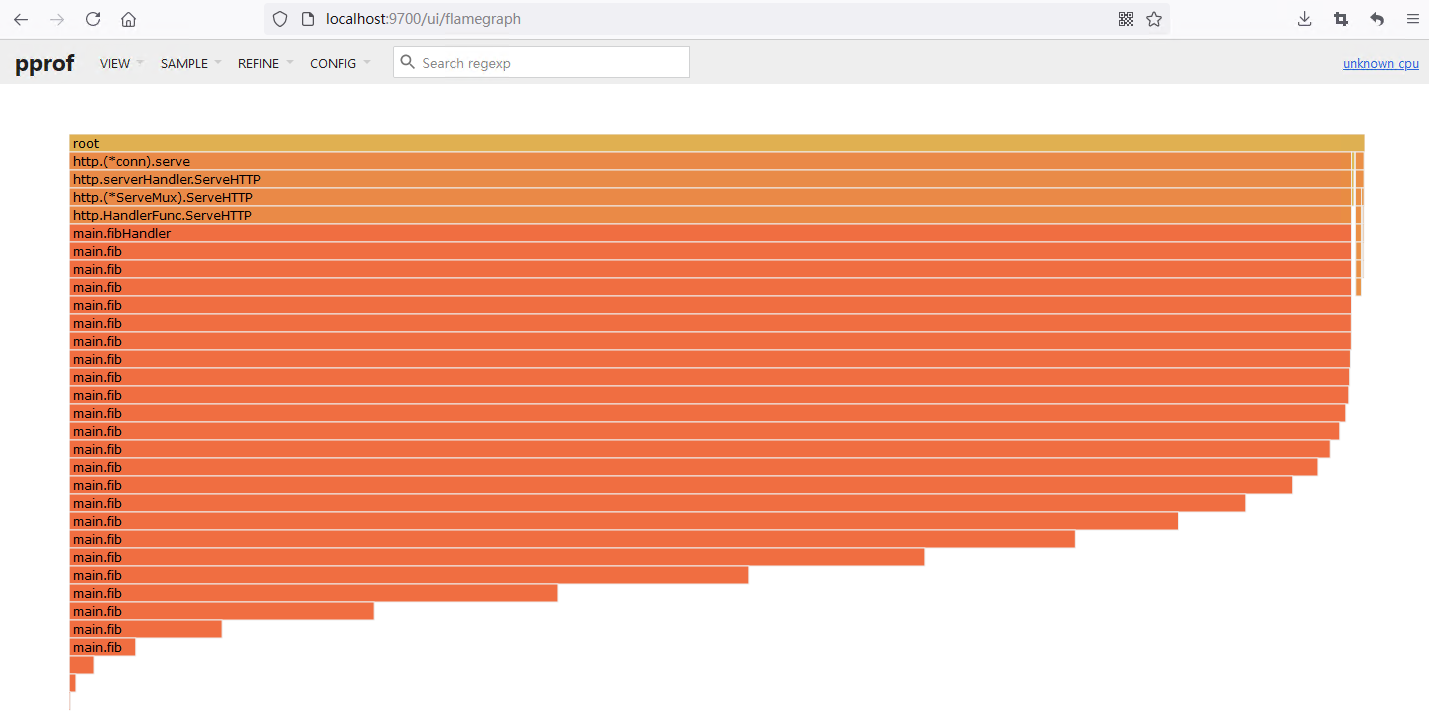
以看出这里除了运行时的消耗,主要就是fibHandler 这个处理的消耗了。
当然一般线上不可能把这个端口开放出来,因为有很大的安全风险。所以,我们一般在线上机器 profile 生成文件,将文件下载到本地分析。
上面我们看到go tool pprof会生成一个文件保存在本地,例如我的机器上是C:\Users\Administrator\pprof\pprof.samples.cpu.001.pb.gz。把这个文件下载到本地,然后:
go tool pprof -http :9700 pprof.samples.cpu.001.pb.gz
net/http/pprof 实现
net/http/pprof的实现也没什么神秘的地方,无非就是在net/http/pprof包的init()函数中,注册了一些处理函数:
// src/net/http/pprof/pprof.go
func init() {
  http.HandleFunc("/debug/pprof/", Index)
  http.HandleFunc("/debug/pprof/cmdline", Cmdline)
  http.HandleFunc("/debug/pprof/profile", Profile)
  http.HandleFunc("/debug/pprof/symbol", Symbol)
  http.HandleFunc("/debug/pprof/trace", Trace)
}
http.HandleFunc()会将处理函数注册到默认的ServeMux中:
// src/net/http/server.go
var DefaultServeMux = &defaultServeMux
var defaultServeMux ServeMux

func HandleFunc(pattern string, handler func(ResponseWriter, *Request)) {
  DefaultServeMux.HandleFunc(pattern, handler)
}
这个DefaultServeMux是net/http的包级变量,只有一个实例。为了避免路径冲突,通常我们不建议在自己编写 HTTP 服务器的时候使用默认的DefaultServeMux。一般都是先调用http.NewServeMux()创建一个新的ServeMux,见上面的 HTTP 示例代码。
再来看net/http/pprof包注册的处理函数:
// src/net/http/pprof/pprof.go
func Profile(w http.ResponseWriter, r *http.Request) {
  // ...
  if err := pprof.StartCPUProfile(w); err != nil {
    serveError(w, http.StatusInternalServerError,
      fmt.Sprintf("Could not enable CPU profiling: %s", err))
    return
  }
  sleep(r, time.Duration(sec)*time.Second)
  pprof.StopCPUProfile()
}
删掉前面无关的代码,这个函数也是调用runtime/pprof的StartCPUProfile(w)方法开始 CPU profiling,然后睡眠一段时间(这个时间就是采样间隔),最后调用pprof.StopCPUProfile()停止采用。StartCPUProfile()方法传入的是http.ResponseWriter类型变量,所以采样结果直接写回到 HTTP 的客户端。
内存 profiling 的实现用了一点技巧。首先,我们在init()函数中没有发现处理内存 profiling 的处理函数。实现上,/debug/pprof/heap路径都会走到Index()函数中:
// src/net/http/pprof/pprof.go
func Index(w http.ResponseWriter, r *http.Request) {
  if strings.HasPrefix(r.URL.Path, "/debug/pprof/") {
    name := strings.TrimPrefix(r.URL.Path, "/debug/pprof/")
    if name != "" {
      handler(name).ServeHTTP(w, r)
      return
    }
  }
  // ...
}
最终会走到handler(name).ServeHTTP(w, r)。handler只是基于string类型定义的一个新类型,它定义了ServeHTTP()方法:
type handler string

func (name handler) ServeHTTP(w http.ResponseWriter, r *http.Request) {
  p := pprof.Lookup(string(name))
  // ...
  p.WriteTo(w, debug)
}
删掉其他无关的代码,就剩下上面两行。统计数据将会写入http.ResponseWriter。
5. Benchmark
其实在Benchmark时也可以生成cpu.profile、mem.profile这些分析文件。我们在第一个示例的目录下新建一个bench_test.go文件:
func BenchmarkFib(b *testing.B) {
  for i := 0; i < b.N; i++ {
    fib(30)
  }
}
然后执行命令go test -bench . -test.cpuprofile cpu.profile:
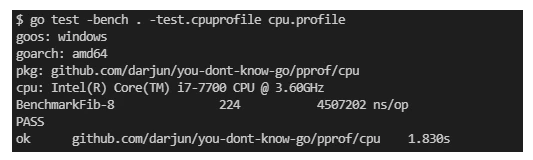
然后就可以分析这个cpu.profile文件了。