
Promethdus
安装
# 下载二进制包
https://prometheus.io/download/
wget https://github.com/prometheus/prometheus/releases/download/v2.30.3/prometheus-2.30.3.linux-amd64.tar.gz

# 解压
tar zxvf prometheus-2.30.3.linux-amd64.tar.gz
mv prometheus-2.30.3.linux-amd64 /usr/local/prometheus
mkdir /etc/prometheus && cd /etc/prometheus
cp /usr/local/prometheus/prometheus.yml .
拷贝 etcd 客户端证书
将 etcd 客户端证书放到 /etc/promethes/etcd-cert 文件夹中
ca.pem client-key.pem client.pem
修改配置文件
global:
  scrape_interval: 15s # Set the scrape interval to every 15 seconds. Default is every 1 minute.
  evaluation_interval: 15s # Evaluate rules every 15 seconds. The default is every 1 minute.

alerting:
  alertmanagers:
    - static_configs:
        - targets:
          # - alertmanager:9093
rule_files:

scrape:
scrape_configs:
  - job_name: "prometheus"
    static_configs:
      - targets: ["localhost:9090"]
  # 添加 etcd 监控
  - job_name: 'etcd'
    scheme: 'https'
    tls_config:
      cert_file: '/etc/prometheus/etcd-cert/client.pem'
      key_file: '/etc/prometheus/etcd-cert/client-key.pem'
      ca_file: '/etc/prometheus/etcd-cert/ca.pem'
    static_configs:
    - targets: ['etcd1:2379','etcd2:2379','etcd3:2379']
  - job_name: 'kafka'
    static_configs:
    - targets: ['127.0.0.1:9308']
  - job_name: "zookeeper-exporter"
    scrape_interval: 60s
    metrics_path: /metrics
    static_configs:
    - targets: ['127.0.0.1:9141']
配置 systemd 服务
创建数据存放文件夹
mkdir /usr/local/prometheus/data
添加 service 配置文件
[Unit]
Description=Prometheus Time Series Collection and Processing Server
Wants=network-online.target
After=network-online.target

[Service]
#User=prometheus
#Group=prometheus
Type=simple
ExecStart=/usr/local/prometheus/prometheus \
    --config.file /etc/prometheus/prometheus.yml \
    --storage.tsdb.path /usr/local/prometheus/data \
    --web.console.templates=/usr/local/prometheus/consoles \
    --web.console.libraries=/usr/local/prometheus/console_libraries \
    --storage.tsdb.retention.size=2GB

[Install]
WantedBy=multi-user.target
启动服务
systemctl enable --now prometheus.service
查看etcd监控任务
http://prometheus-ip:9090/targets
查看 metrics,需要携带证书访问
curl -L --cert client.pem --key client-key.pem https://etcd1:2379/metrics -k
配置 kafka exporter
https://github.com/danielqsj/kafka_exporter
wget https://github.com/danielqsj/kafka_exporter/releases/download/v1.4.2/kafka_exporter-1.4.2.linux-amd64.tar.gz
tar zxvf kafka_exporter-1.4.2.linux-amd64.tar.gz
mv kafka_exporter-1.4.2.linux-amd64 /usr/local/prometheus/kafka-exporter
配置系统服务
[Unit]
Description=kafka-exporter
After=time-sync.target network.target

[Service]
Type=simple
ExecStart=/usr/local/prometheus-exporter/kafka-exporter/kafka_exporter --kafka.server=ceph1:9092 --kafka.server=ceph2:9092 --kafka.server=ceph3:9092
Restart=always
RestartSec=2s
StandardOutput=null

[Install]
WantedBy=multi-user.target
systemctl enable --now kafka-exporter
配置 zookeeper exporter
https://github.com/dabealu/zookeeper-exporter
wget https://github.com/dabealu/zookeeper-exporter/releases/download/v0.1.12/zookeeper-exporter-v0.1.12-linux.tar.gz
tar zxvf zookeeper-exporter-v0.1.12-linux.tar.gz
mv zookeeper-exporter-v0.1.12-linux /usr/local/prometheus-exporter/zookeeper-exporter
配置系统服务
[Unit]
Description=zookeeper-exporter
After=time-sync.target network.target

[Service]
Type=simple
ExecStart=/usr/local/prometheus-exporter/zookeeper-exporter/zookeeper-exporter -zk-hosts='ceph1:2181,ceph2:2181,ceph3:2181'
Restart=always
RestartSec=2s
StandardOutput=null

[Install]
WantedBy=multi-user.target
systemctl enable --now zookeeper-exporter
添加 zookeeper 信任命令
vim /usr/local/kafka/config/zookeeper.properties 添加如下
4lw.commands.whitelist=mntr,ruok
逐一重启 zookeeper 服务
Grafana
dnf install grafana
systemctl enable --now grafana-server.service
添加数据源
添加 prometheus 数据源
Grafana官网:https://grafana.com/grafana/dashboards/3070
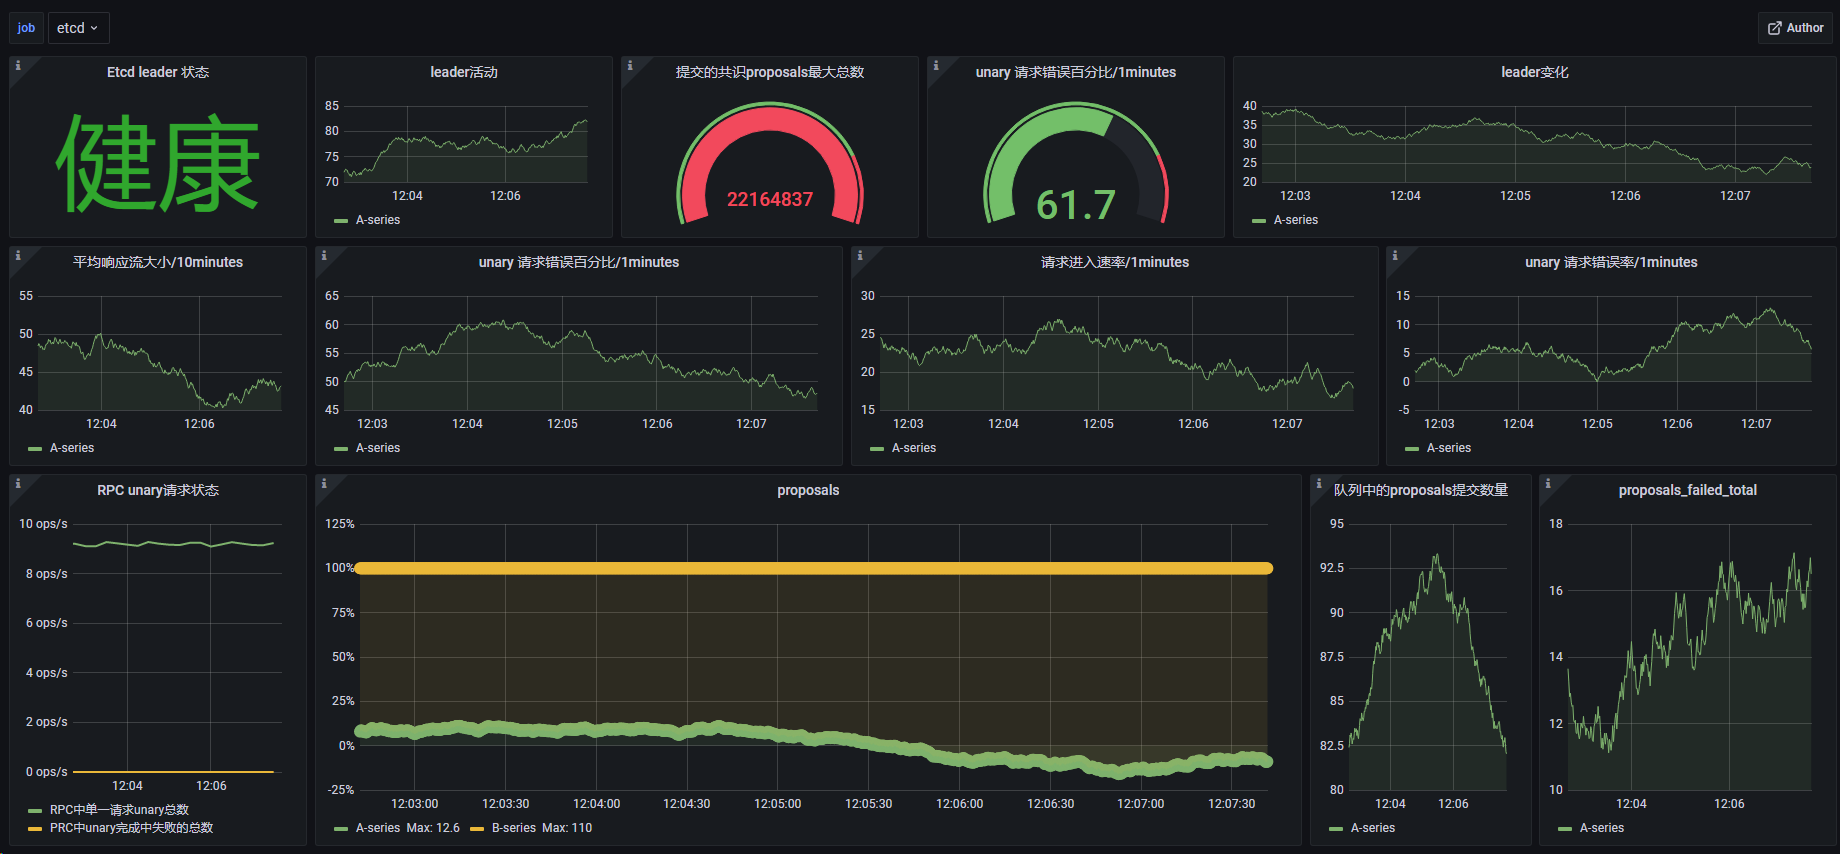
etcd dashboard
推荐插件:https://grafana.com/grafana/dashboards/3070
Deprecated etcd_debugging_mvcc_db_total_size_in_bytes Prometheus metric. Use etcd_mvcc_db_total_size_in_bytes instead.
中文版ETCD集群插件:https://grafana.com/grafana/dashboards/9733
kafka dashboard
https://grafana.com/grafana/dashboards/7589